 |
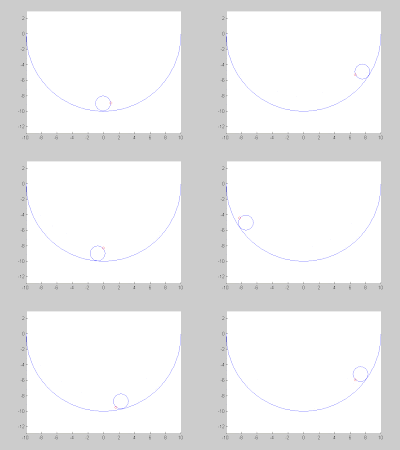
| A sphere roll without slipping in a bowl. I made this with Matlab. Code is pasted below. |
Original code:
import numpy as np
import matplotlib.pyplot as plt
import matplotlib.animation as animation
def update_line(time, cir, dot,l2,l3):
t = 100*(time+1)/1000 #0.1 second
thetat = - np.sin(k*t) + theta0;
alphat = (R/a-1)*thetat+np.pi/2;
cir[0,:] = (R-a)*np.sin(thetat)
cir[1,:] = -(R-a)*np.cos(thetat)
dot[0,:] = (R-a)*np.sin(thetat)+a*np.sin(alphat)
dot[1,:] = -(R-a)*np.cos(thetat)+a*np.cos(alphat)
#print(dd)
l2.set_data(cir)
l3.set_data(dot)
return l2, l3
R=10
fig1 = plt.figure()
xx = np.linspace(-10,10,200)
yy = -np.sqrt(R**2 - np.square(xx))
#data = np.random.rand(2, 25)
l, = plt.plot(xx, yy, 'r-')
plt.xlim(-10, 10)
plt.ylim(-15, 5)
plt.xlabel('x')
plt.title('test')
plt.axis('equal')
a = 4;
c = 1+ 2/5;
k = 9.8/(R-a)/c;
theta0 = 0;
t = 0;
thetat = - np.sin(k*0) + theta0;
alphat = (R/a-1)*thetat+np.pi/2;
l2, = plt.plot([], [], 'bo',markersize=182,fillstyle='none',markeredgewidth=5)
cir = np.zeros((2,1))
dot = np.zeros((2,1))
l3, = plt.plot([], [], 'ko',markersize=20,fillstyle='none',markeredgewidth=5)
line_ani = animation.FuncAnimation(fig1, update_line, 200, fargs=(cir, dot, l2,l3),
interval=1, blit=True)
#frame number 500 gets passed in to the called function, that is num
line_ani.save('frictionalroll.mp4',writer = 'ffmpeg',fps='24')
plt.show()
Matlab code for the first GIF animation (including the GIF export):
function testanimation
h = figure;
hold on;
b=10;
bcirx = -10:0.1:10;
bciry = sqrt(b^2-bcirx.^2);
a = 1;
plot(bcirx,-bciry);
axis equal
c = 1+ 2/5;
k = 9.8/(b-a)/c;
theta0 = 0;
for t = 0.01:0.1:30;
thetat = - sin(k*t) + theta0;
alphat = (b/a-1)*thetat+pi/2;
if t ==0.01;
cirhandle = plot((b-a)*sin(thetat),-(b-a)*cos(thetat),'bo','MarkerSize',32);
dothandle = plot((b-a)*sin(thetat)+a*sin(alphat),-(b-a)*cos(thetat)+a*cos(alphat),'ro','MarkerSize',5);
frame = getframe(h);
im = frame2im(frame);
[imind,cm] = rgb2ind(im,256);
imwrite(imind,cm,'animationgif.gif','gif', 'Loopcount',inf,'DelayTime',0.0001);
else
set(cirhandle,'Xdata',(b-a)*sin(thetat));
set(cirhandle,'Ydata',-(b-a)*cos(thetat));
set(dothandle,'Xdata',(b-a)*sin(thetat)+a*sin(alphat));
set(dothandle,'Ydata',-(b-a)*cos(thetat)+a*cos(alphat));
pause(0.0001)
frame = getframe(h);
im = frame2im(frame);
[imind,cm] = rgb2ind(im,256);
imwrite(imind,cm,'animationgif.gif','gif','WriteMode','append','DelayTime',0.0001);
end
end
pause(0.0001)
end
No comments:
Post a Comment